We started Kubernetic as a desktop app early-on for Kubernetes, because we saw the potential of Kubernetes itself for power users, but also the complexity it poses for newcomers and it steep learning curve, so we’ve built it focusing on two main factors, productivity for power users and discoverability for newcomers.
Today, we release v3.1.0, with a theme. A main feature that is a bit of-course of those two factors, but our users (that’s you) have asked for it and we couldn’t resist the temptation to satisfy you, so here you have it, but don’t worry cause we have other treats as well, just keep reading.
Dark Mode 😎 is here!
Now you can toggle dark mode from preferences, and say bye-bye to eye strain.
Metrics Columns
In release v3.0.0 we introduced dynamic tables where all resources columns are rendered server-side by kubernetes, so now Kubernetic displays the exact same columns as kubectl for any resource (with optional extra columns using kubectl -o wide)
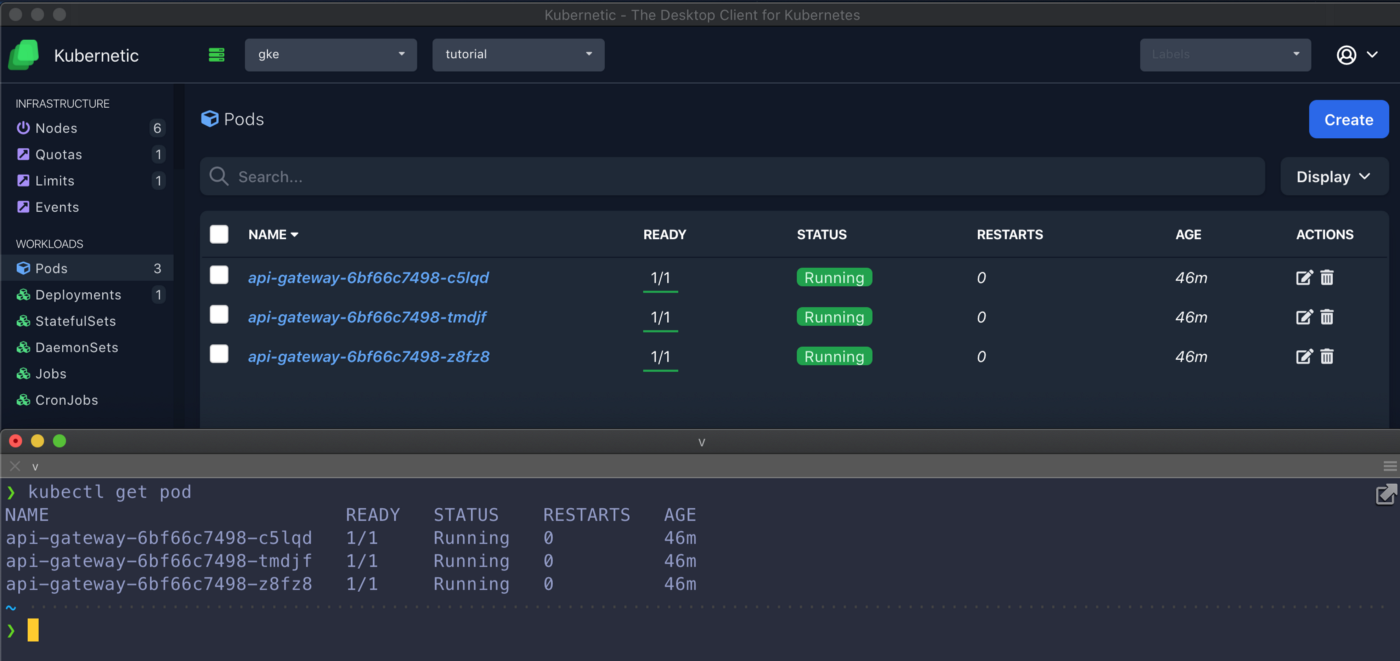
Now, we’ve also embedded two metrics columns: the cpu & memory usage consumption (same info you retrieve using kubectl top pod) with calculated percentage (against resource limits), and aggregated values (e.g. total memory consumption of a deployment with 3 pods):
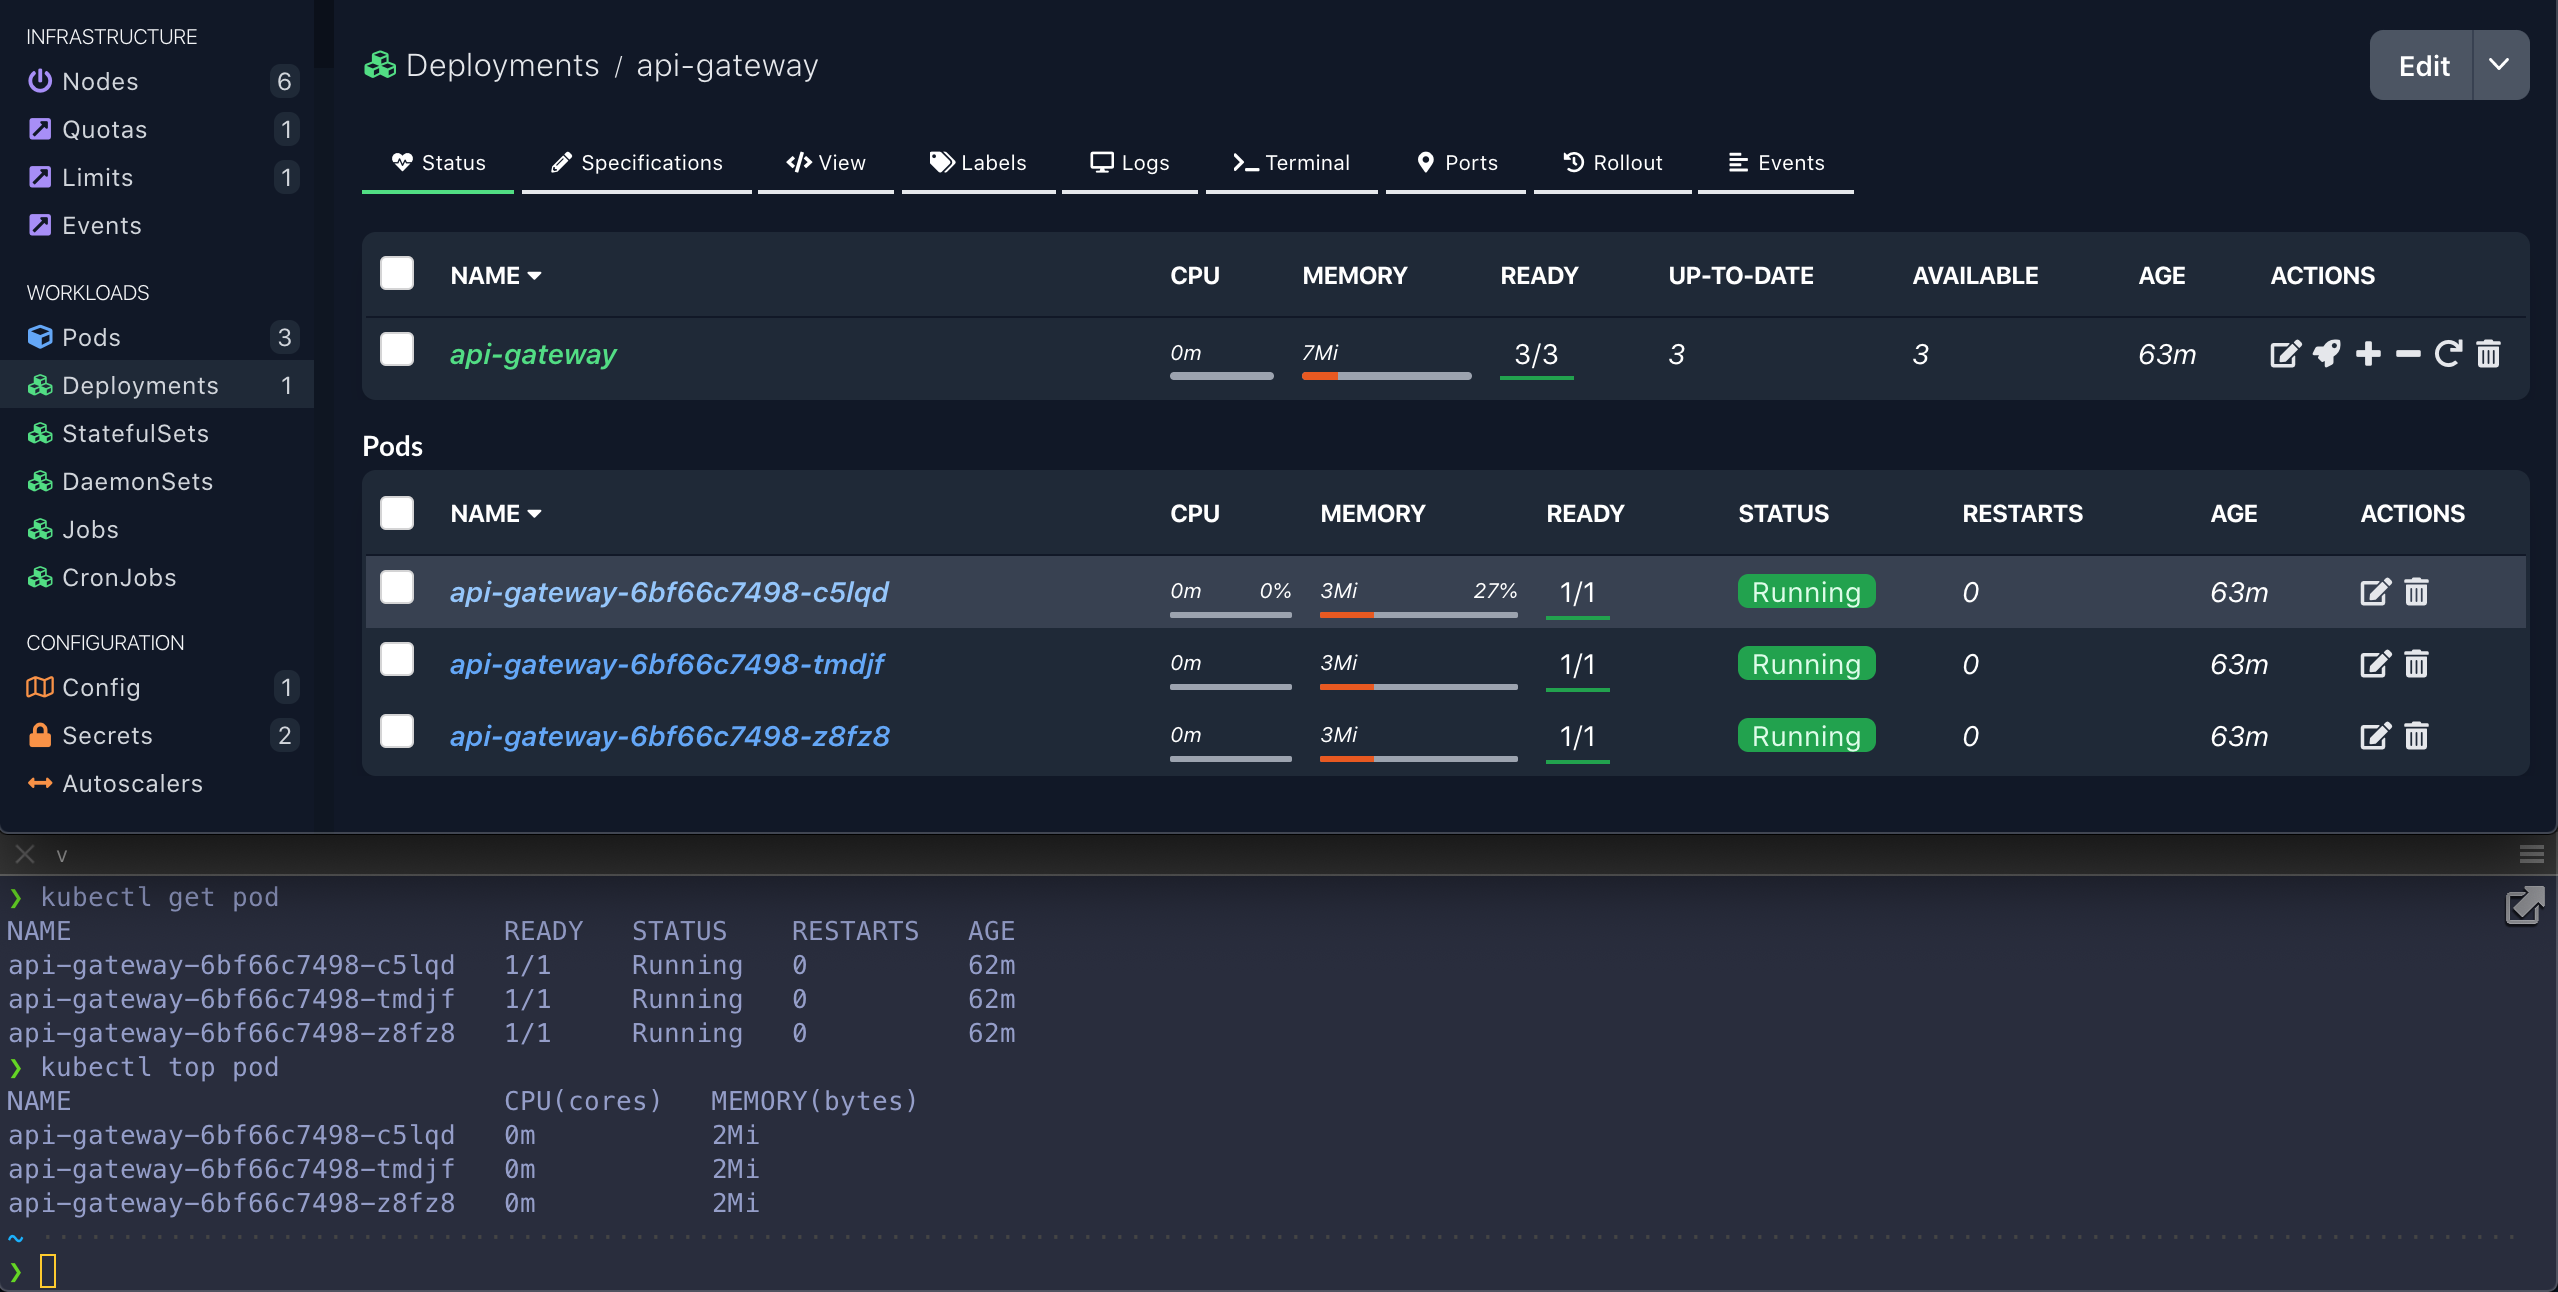
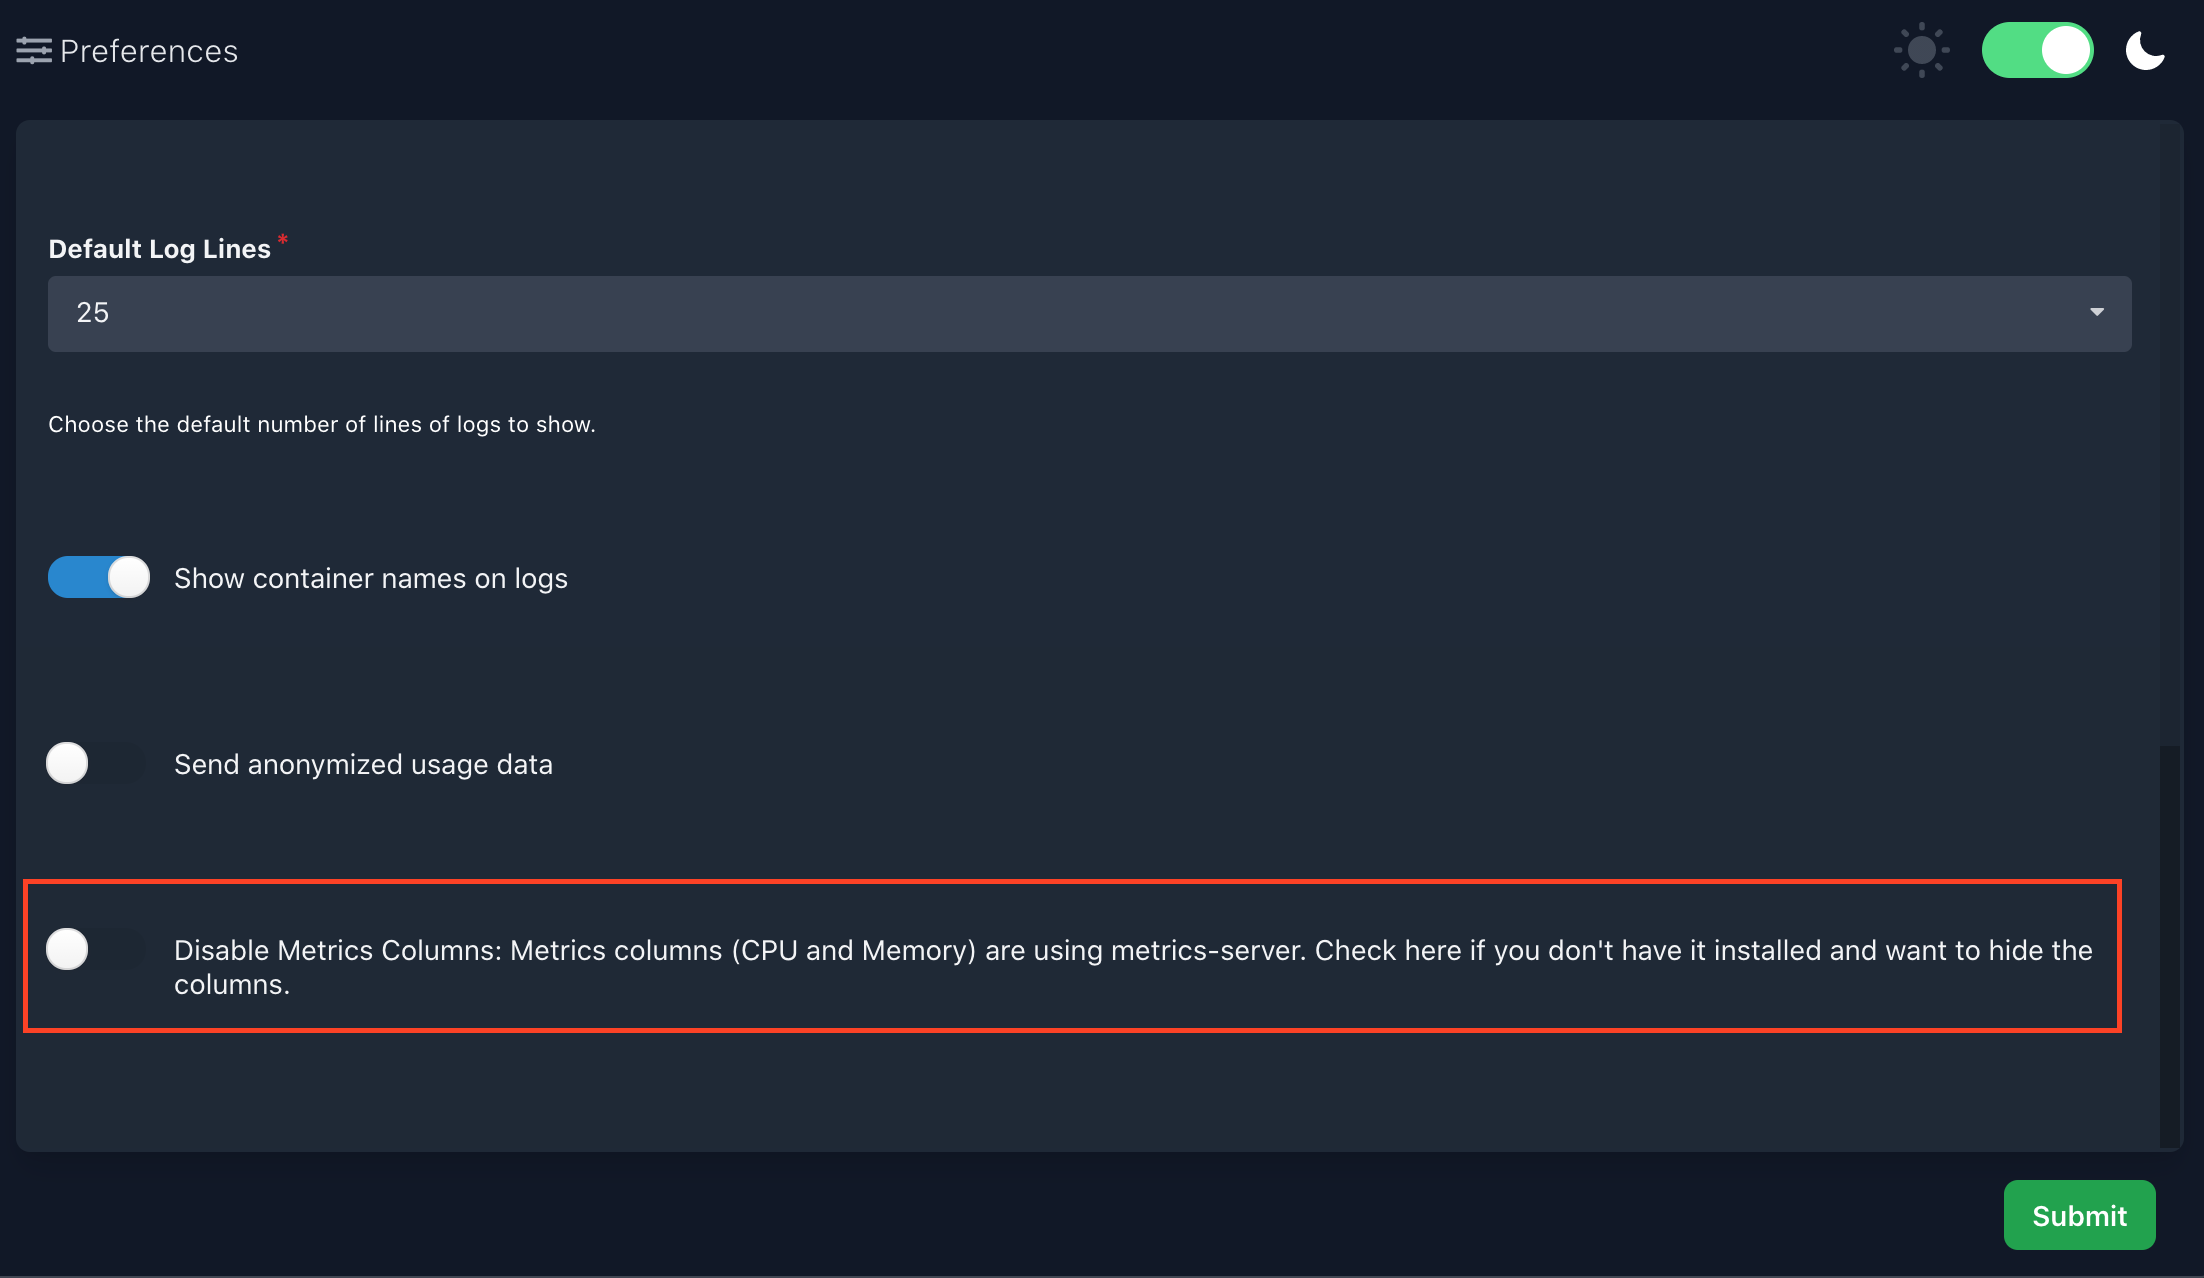
Metrics columns can be opt-out from the preferences section, as they need a metrics-server running in your cluster, same as kubectl top does.
Menu Counters
Due to popular demand we restated the resource counters we had on the side menu and ditched the foldable menus, to boost productivity. One main request was the ability to quickly navigate between resources, and foldable menus where simply one click more away. The other aspect was the ability to navigate between namespaces and quickly see the existing resources without having to drill down each view.
And much more...
Below is a list of smaller features that worth mentioning, you can also check the full changelog on GitHub.
- Tooltips on action buttons: Now hovering the action buttons you get a tooltip of what action is performed.
- Tooltips on Table columns: Hovering on the table column names will provide a description of the column.
- Events: Added Events section that displays the events of the entire namespace, and Events tab on each resource that displays the related events.
- Add support for service port-forwarding with named ports: You can now port-forward services that use named ports (e.g. http) instead of port numbers (e.g. 80)
- Improved Startup time: We now use a better cache mechanism that improved cold startup time and keep warm cache of the discovery metadata for even faster warm startup, though we never cache actual data to avoid displaying stale info on the UI.
Next steps
As usual, here is a quick peek of our next steps:
- Enterprise Mode: Support for deploying Kubernetic on-cluster for multiple users, each one with their respective granted privileges.
- Tekton integration: Support for designing and running Tekton Tasks and Pipelines is coming up soon.
- ArgoCD integration: Support for designing and managing ArgoCD applications is coming up soon.
You can download Desktop edition and try it for 30 days for free, if you’re interested for the enterprise edition you can signup here.